Your Partner for Global Flight Operations
Thousands of flight departments of all sizes trust Universal to help them plan and execute their international missions smoothly and successfully.


With us, you’ll overcome the biggest challenges of operating internationally.

Increasing operating complexity
Global regulations impacting international operators continually increase and evolve. Our consultative experts will help you easily navigate them.

High expectations
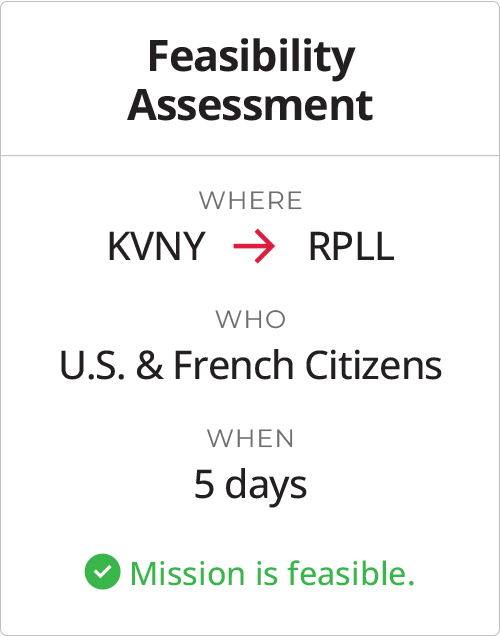
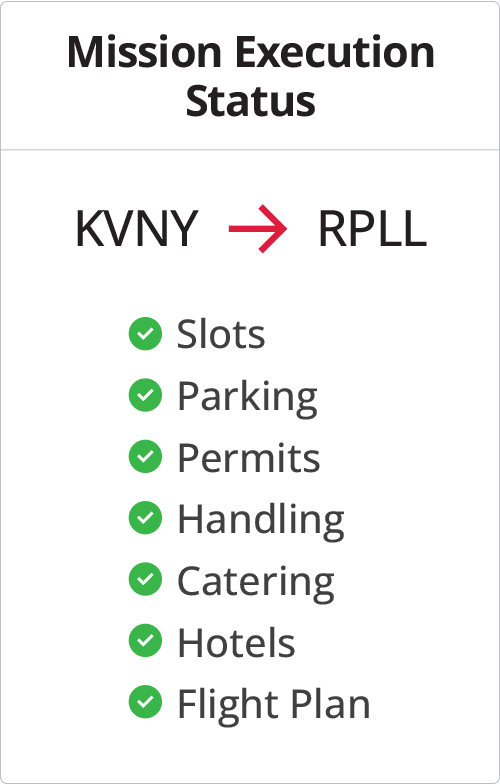
You need to quickly assess what your best trip options are and perfectly execute the path you choose. We provide the global intelligence and expertise to help you do both.

Unplanned situations & last-minute changes
Anything can happen to a perfectly planned mission at any time. With our global resources, you can adapt and recover better than anyone else.
Popular Services and Solutions
Make all your international missions smooth and successful with Universal.
-
 Trip Support
Your international trips made simple with the help of our global team of experts.
Trip Support
Your international trips made simple with the help of our global team of experts.
-
 Regulatory
Stay on top of changing regulatory programs, while reducing your admin burden.
Regulatory
Stay on top of changing regulatory programs, while reducing your admin burden.
-
 Mission Planning Software
Research trip requirements and options in record time.
Mission Planning Software
Research trip requirements and options in record time.
-
 Mission Management Software
Build and manage your international trips from beginning-to-end.
Mission Management Software
Build and manage your international trips from beginning-to-end.
-
 FBOs & Ground Support
Enjoy an amazing ground experience in over 30 countries where we’re located.
FBOs & Ground Support
Enjoy an amazing ground experience in over 30 countries where we’re located.
-
 Inflight Catering
A consistently simple and enjoyable inflight catering experience at over 1,800 airports.
Inflight Catering
A consistently simple and enjoyable inflight catering experience at over 1,800 airports.
Our >1,700 people around the world are ready to do everything it takes to make your missions successful.


Global airport information
The industry’s best expertise and resources supporting your missions.


Experience from managing over 4 million international trip legs – more than anyone else.


Strongest knowledge base of international mission planning expertise.


1,700+ people across 30+ countries ready to support your missions.
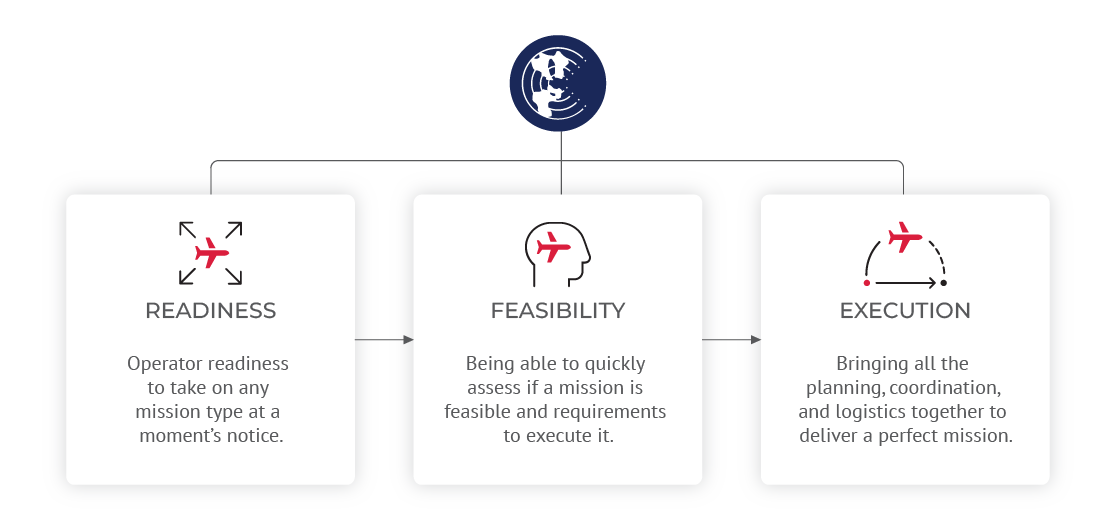
International Ops Best Practice
The Three Pillars of Mission Success
Discover our approach for reducing operational risk and friction on every mission we manage.